Posted on Leave a comment

Remote debugging over SSH (Windows)

Remote debugging is a feature of the ICEbearPlus extended debugging toolchain. It enables you to grant access to a locally running debug agent by using SSH tunneling feature of the third party application Putty. For example, if your hardware shows a problem in the field or development of a new flash driver is required, debugging service can be provided by us without the requirement to send hardware.  So the steps for a service technician are:

  • (Inform sysadmin about the action to avoid paranoia)
  • Obtain Putty.exe from putty.org
  • Run it
  • Configure the tunnel
  • Start the debug agent

Configuring the tunnel session

Add the host name and port as shown below. You may want to get back to this menu later and Save this session for later use.

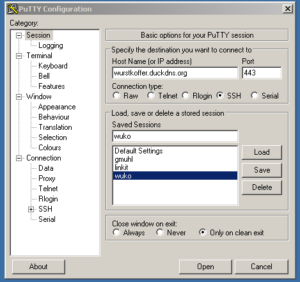
When you make a connection, a black terminal window pops up and will ask you for login data (sent to you separately).

Configure the tunnel

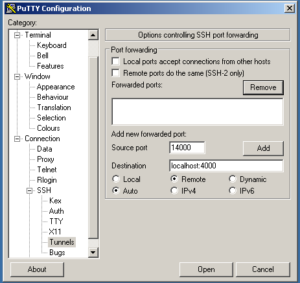
To grant access to a local port of your computer, the tunnel needs to be configured as ‘Remote’, i.e. the ‘Source port’ of the remote host is forwarded to the local port. Means, an authorized person logged in on the remote server can connect to your local port as long as Putty is active.

To open a remote port forward, add ‘Source port’ and ‘Destination’ as shown below and click ‘Add’. Do the same for both ports 2000 and 4000 for the local gdbproxy server, such that the settings are displayed in the image on the bottom.

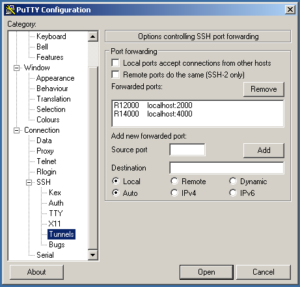
Then you can connect using ‘Open’.

gdbproxy debugging

Start the gdbproxy server via the Start menu through the ICEbear->Start gdbproxy entry.

Then the gdbserver should fire up as shown below.

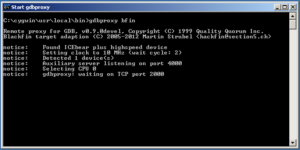
Once a connection is made, you can see this on the console. Also, the status during debugging is displayed. If the connection through the tunnel is effective (i.e. Putty tunnel session active) a connection can be made.

A safety notice: No other person aware of this information can connect to your target. Only authorized persons with a login can access your local ports during an active session. Once you terminate the Putty session by closing the window, all connections are terminated and no more access from outside is possible.

Service package

Available remote debugging services:

  • Analog Devices Blackfin targets (ICEbearPlus and service contract required)
  • netpp node or dombert IP camera hardware (ZPUng)
  • ARM based systems supported by OpenOCD
Posted on Leave a comment

Lattice VIP MJPEG Inbetriebnahme

Das von Lattice Semiconductor zu einem Spezialpreis von 199 USD angebotene Entwicklungs-Kit (Embedded Vision Development Kit) oder auch VIP ist eine vollwertige Stereokamera für die Entwicklung von Standard-Vision-Anwendungen auf Basis der FPGA-Familie ECP5 und CrossLink von Lattice. Es bietet als optionale Erweiterung ein Zusatzboard mit GigE-fähigem Netzwerkstecker und USB 3.0 kompatiblen Cypress FX3 Chipsatz an.

Der Bild-Erfassungs-Teil des VIP ist mit zwei Rolling-Shutter Sensoren IMX214 von Sony ausgestattet, deren Bilddaten über einen ebenfalls von Lattice stammenden CrossLink-Baustein vom schwierig zu handhabenden MIPI-Interface in einen parallelen Video-Strom umgewandelt werden. Dabei gibt es unterschiedliche Firmware für den Crosslink:

  1. Stereo-Modus: Beide Sensorenbilder werden on-chip zusammengefügt, die Fenstergrösse halbiert
  2. Monokel-Modus: Nur die Bilddaten eines Sensors (CN2) werden weitergeleitet

Die entsprechenden Bit-Files sind bei Lattice nach Registrierung zum Download verfügbar [ Link ]

JPEG-Streaming

Genau wie beim älteren Entwicklerkit HDR60 von Lattice ist auch hier eine Motion-JPEG-Demo-Firmware verfügbar, welche auf der bewährten gstreamer-Referenzumgebung für den Empfang von Video mit niedriger Latenz basiert.

Dazu wird zunächst ein Script für den Empfang erstellt:

caps="application/x-rtp, media=\(string\)video,"
caps="$caps clock-rate=\(int\)90000,"
caps="$caps encoding-name=\(string\)JPEG"

gst-launch-1.0 -v udpsrc \
caps="$caps" \
port=2020 \
! rtpjpegdepay \
! jpegdec \
! autovideosink

Beim Aufruf dieses Scripts unter Linux wie unter Windows startet gstreamer eine RTP-Empfängerpipeline und zeigt den Videostrom an, sobald dieser eintrifft. Dieser muss zunächst am VIP konfiguriert werden

Anleitung

  1. USB-Programmier-Kabel  verbinden, Terminal-Programm konfigurieren: 115200 bps, 8N1
  2. Unter Linux mit /dev/ttyUSB1 verbinden
  3. Bit-File per Diamond-Programmer auf den Target laden
  4. Im Terminal die IP-Adresse des Empfängers konfigurieren:
    r 192.168.0.2
  5. ARP-Antwort abwarten:
    # Got ARP reply: 44 ac de ad be ef
  6. JPEG-Video starten, z.b. in 1920×1080 bei 12fps:
    j 4

Falls der JPEG-Strom abreisst, ist dafür meistens ein Engpass im Encoding dafür verantwortlich. Da JPEG über keine eingebaute Rate-Control verfügt, kann in der Demo das System u.U. zum Stillstand gebracht werden, z.B. indem ein buntes Tuch vor die Kamera gehalten wird. Das detaillierte Muster ist in der Regel schlechter zu komprimieren und kann so eine Verstopfung im Datenfluss verursachen.

Der JPEG-Encoder meldet diese Fehler unmittelbar und bricht in dieser Demo ab. Zu den detaillierten Fehlermeldungen konsultieren Sie bitte die Dokumentation zum MJPEG Encoder.

Konfiguration der Sensor-Parameter

Per i2c-Bus können die angeschlossenen Sensoren konfiguriert werden. Dies geschieht über das ‘i’-Kommando. Dessen Funktion ist von der Anzahl der Parameter abhängig:

# i2c-Bus scannen:

i

# i2c-Register abfragen (Registerwerte hexadezimal):

i 100

# i2c-Register setzen

i 100 1

Einige vereinfachte Kommandos zur Sensorenkonfiguration (auch hier alle Werte in Hexadezimalform):

Funktion

Kommando
se [Wert] Belichtungszeit
sh [HDR_modus] Belichtungszeit
sr [Gain] Verstärkung (Gain) rot
sg [Gain] Verstärkung grün
sb [Gain] Verstärkung blau

Probleme und Lösungen

  • Video startet nicht:
    1. Fehlermeldungen an Konsole überprüfen
    2. Überprüfen, ob orange LED am GigE-Board Aktivität anzeigt
    3. Wireshark zur Aufzeichnung der Aktivität am Netzwerk benutzen
  • Video startet, aber reisst ab:
    1. Fehlerbits an Konsole überprüfen: [DEMUX], [FIFO], …
    2. Qualitätswert vergrössern:
      q 30
    3. Netzwerkverkehr mit Wireshark und RTP-Parser überprüfen. Gehen Pakete verloren?
    4. Direktverbindung zwischen VIP und PC nutzen (kein zwischengeschalteter Router)
  • Video fehlerhaft:
    1. Fehlerbits an Konsole überprüfen. DEMUX-Fehler dürfen sporadisch (bis zu fünf mal) auftreten, bevor der Video-Strom terminiert wird.


Posted on Leave a comment

MaSoCist opensource 0.2 release

I’ve finally got to release the opensource tree of our SoC builder environment on github:

https://github.com/hackfin/MaSoCist

Changes in this release:

  • Active support for Papilio and Breakout MachXO2 board had been dropped
  • Very basic support for the neo430 (msp430 compatible) added, see Docker notes below
  • Includes a non-configureable basic ‘eval edition’ (in VHDL only) of our pipelined ZPUng core
  • Basic Virtual board support (using ghdlex co-simulation extensions)
  • Docker files and recipes included

Docker environment

Docker containers are in my opinion the optimum for automated deployment and for testing different configurations. To stay close to actual GHDL simulator development, the container is based on the ghdl/ghdl:buster-gcc-7.2.0 edition.

Here’s a short howto to set up an environment ready to play with. You can try this online at

https://labs.play-with-docker.com, for example.

Just register yourself a Docker account, login and start playing in your online sandbox.

If you want to skip the build, you can use the precompiled docker image by running

docker run -it -v/root:/usr/local/src hackfin/masocist

and skip (3.) below.

You’ll need to build and copy some files from contrib/docker to the remote Docker machine instance.

  1. Run ‘make dist’ inside contrib/docker, this will create a file masocist_sfx.sh
  2. Copy Dockerfile and init-pty.sh to Docker playground by dragging the file onto the shell window
  3. Build the container and run it:
    docker build -t masocist .
    
    docker run -it -v/root:/usr/local/src masocist
  4. Copy masocist_sfx.sh to the Docker machine and run, inside the running container’s home dir (/home/masocist):
    sudo sh /usr/local/src/masocist_sfx.sh
  5. Now pull and build all necessary packages:
    make all run
  6. If nothing went wrong, the simulation for the neo430 CPU will be built and started with a virtual UART and SPI simulation. A minicom terminal will connect to that UART and you’ll be able to speak to the neo430 ‘bare metal’ shell, for example, you can dump the content of the virtual SPI flash by:
    s 0 1
    

    Note: This can be very slow. On a docker playground virtual machine, it can take up to a minute until the prompt appears, depending on the server load.

Development details

The simulation is a cycle accurate model of your user program, which you can of course modify. During the build process, i.e. when you run ‘make sim’ in the masocist(-opensource) directory, the msp430-gcc compiler builds the software C code from the sw/ directory and places the code into memory according to the linker script in sw/ldscripts/neo430. This results in a ELF binary, which is again converted into a VHDL initialization file for the target. Then the simulation is built.

The linker script is, however very basic. Since a somewhat different, automatically generated memory map is used at this experimental stage, all peripherals are configured in the XML device description at hdl/plat/minimal.xml, however the data memory configuration (‘dmem’ entity) does not automatically adapt the linker script.

Turning this into a fully configurable solution is left to be done.