Posted on

VHDL simulation remote display

In the previous article we described the netpp server enhancements to our GHDL based simulation to feed data to a FIFO. So we had condemned that extra thread being a slave listening to commands. But what if the GHDL-Simulation would be a netpp master?

Inspired by Yann Guidons framebuffer example at http://ygdes.com/GHDL/, the thought came up: why not hack a netpp client and use the existing ‘display’ device server (which we use for our intelligent camera remote display). What performance would it have?

For this, we extended our libnetpp.vhdl bindings by a few functions:

  • function device_open(id: string) return netpphandle_t — Opens a connection to a netpp (remote) device
  • function initfb(dev: netpphandle_t; x: integer; y: integer; buftype: integer) return framebuffer_t — Initialize virtual frame buffer from device
  • procedure setfb(fb: framebuffer_t; data: pixarray_t) — transfer data to framebuffer

Not to forget the cleanup functions device_close() and releasefb().

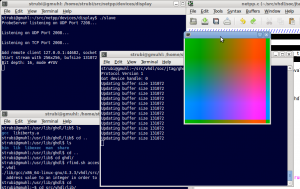
With this little functionality, we are running a little YUV color coded display as shown below:

Framebuffer output

It is very slow as  we keep repeatedly filling the YUV (more precisely UYVY interleaved data) using a clock sensitive process. We thus get a framerate of about 1fps – but it works!

The ghdlex source code is now hosted publicly at:

https://github.com/hackfin/ghdlex

Posted on

Asynchronous remote simulation using GHDL

Simulation is daily business for hardware developers, you can’t get things running right by just staring at your VHDL code (unless you’re a real genius).

There are various commercial tools out there which did the job so far: MentorGraphics, Xilinx isim, and many more, the limit mostly being your wallet.

We’re not cutting edge chip designers, so we used to work with the stuff that comes for free with the standard FPGA toolchains. However, these tools – as all proprietary stuff – confront you with limitations sooner or later. Moreover, VHDL testbench coding is a very tedious task when you need to cover all test scenarios. Sooner or later you’ll want to interface with some real world stuff, means: the program that should work with the hardware should first and likewise be able to talk to the simulation.

The interfacing

Ok, so we have a program written in say, C – and a hardware description. How do we marry them? Searching for solutions, it turns out that the OpenSource GHDL simulation package is an ideal candidate for these kind of experiments. It implements the VHPI-Interface, allowing to integrate C routines into your VHDL simulation. Its implementation is not too well documented, but hey, being able to read the source code compensates that, doesn’t it?

So, we can call C routines from our simulation. But that means: The VHDL side is the master, or rather: It implements the main loop. This way, we can’t run an independent and fully asynchronous C procedure from the outside – YET.

Assume we want to build up some kind of communication between a program and a HDL core through a FIFO. We’d set up two FIFOs really..one for Simulation to C, and one for the reverse direction. To run asynchronously, we could spawn the C routine into a separate thread, fill/empty the FIFO in a clock sensitive process from within the simulation (respecting data buffer availability) and run a fully dynamic simulation. Would that work? Turns out it does. Let’s have a look at the routine below.

mainclock:
process -- clock process for clk
begin
    thread_init; -- Initialize external thread
    wait for OFFSET;
    clockloop : loop
        u_ifclk <= '0';
        wait for (PERIOD - (PERIOD * DUTY_CYCLE));
        u_ifclk <= '1';
        wait for (PERIOD * DUTY_CYCLE);
        if finish = '1' then
            print(output, "TERMINATED");
            u_ifclk <= 'X';
            wait;
        end if;
    end loop clockloop;
end process;

Before we actually start the clock, we initialize the external thread which runs our C test routine. Inside another, clock sensitive process, we call the simulation interface of our little C library, for example, the FIFO emptier. Of course we can keep things much simpler and just query a bunch of pins (e.g. button states). We’ll get to the detailed VHPI interfacing later.

Going “virtual”

The previous method still has some drawbacks: We have to write a specific thread for all our asynchronous, functionality specific C events. This is not too nice. Why can’t we just use a typical program that talks a UART protocol, for example, and reroute this into our simulation?

Well, you expected that: yes we can. Turns out there is another nice application for our netpp library (which we have used a lot for remote stuff). Inside the thread, we just fire up a netpp server listening on a TCP port and connect to it from our program. We can use a very simple server for a raw protocol, or use the netpp protocol to remote-control various simulation properties (pins, timing, stop conditions, etc).

This way, we are interactively communicating with our simulation for example through a python script with the FIFO:

import time
import netpp dev = netpp.connect("localhost")
r = dev.sync()
r.EnablePin.set(1) # arm input in the simulation
r.Fifo.set(QUERY_FRAME) # Send query frame command sequence
frame = r.Fifo.get() # Fetch frame
hexdump(frame) # Dump frame data

Timing considerations

When running this for hours, you might realize that your simulation setup takes a lot of CPU time. Or when you’re plotting wave data, you might end up with huge wave files with a lot of “idle data”. Why is that? Remember that your simulation does not run ‘real time’. It simulates your entire clocked architecture just as fast as it can. If you have a fast machine and a not too complex design, chances are that the simulation actually has a shorter runtime that its actual realtime duration.

So for our clock main loop, we’d very likely have to insert some wait states and put the main clock process to sleep for a few µs. Well, now we’d like to introduce the resource which has taught us quite a bit on how to play with the VHPI interface: Yann Guidons GHDL extensions. Have a look at the GHDL/clk/ code. Taking this one step further, we enhance our netpp server with the Clock.Start and Clock.Stop properties so we can halt the simulation if we are idling.

Dirty little VHPI details

Little words have been lost about exactly how it’s done. Yanns examples show how to pass integers around, but not std_logic_vectors. However, this is very simple: they are just character arrays. However, as we know, a std_logic has not just 0 and 1 states, there are some more (X, U, Z, ..)

Let’s have a look at our FIFO interfacing code. We have prototyped the routine sim_fifo_io() in VHDL as follows:

procedure fifo_io( din: inout fdata; flags : inout flag_t );
    attribute foreign of fifo_io : procedure is "VHPIDIRECT sim_fifo_io";

The attribute statement registers the routine as externally callable through the VHPI interface. On the C side, our interface looks like:

void sim_fifo_io(char *in, char *out, char *flag);

The char arrays just have the length of the std_logic_vector from the VHDL definition. But there is one important thing: the LSB/MSB order is not respected in the indexing order of the array. So, if you have a definition for flag_t like ‘subtype flag_t is unsigned(3 downto 0)’, flag(3) (VHDL) will correspond to flag[0] in C. If you address single elements, it might be wise to reorder them or not use a std_logic_vector. See also Yanns ’bouton’ example.

Conclusion and more ideas

So with this enhancement we are able to:

  • Make a C program talk to a simulation – remotely!
  • Allow the same C program to run on real hardware without modifications
  • Trigger certain events (those nasty ones that occur in one out of 10000) and monitor them selectively
  • Script our entire simulation using Python

Well, there’s certainly more to it. A talented JAVA hacker could probably design a virtual FPGA board with buttons and 7 segment displays without much effort. A good starting point might be the OpenSource goJTAG application (for which we hacked an experimental virtual JTAG adapter that speaks to our simulation over netpp). Interested? Let us know!

Update: More of a stepwise approach is shown at http://www.fpgarelated.com/showarticle/20.php

Another update: Find my presentation and paper for the Embedded World 2012 trade show here:

Posted on 2 Comments

In circuit emulation for the ZPU

So, you’ve been getting used to JTAG for debugging CPUs and funky reverse engineering, haven’t you?

Let’s move to something more constructive. The ZPU softcore has been out for a while. It’s intriguingly simple to use and is really saving on resources. Moreover, it has a fully functional toolchain, simulator and debugger. So why not take this on to the hardware?

The shopping list:

  1. A Test Access Port implementation (TAP)
  2. A piece of software wrapping all the gdb command primitives
  3. A JTAG adapter

The TAP

Lets summarize again on the functionality we expect from a debug port. We want to:

  1. Stop CPU, resume
  2. Single step through code
  3. Read and write PC, SP and other registers
  4. Access Memory (program memory, stack, I/O)
  5. Set software breakpoints in the code

So, the ZPU needs a breakpoint instruction. Well, it does have one! Just that it hasn’t been handled (apart from the simulation) until now. What else is missing? Basically, the EMULATION state. Emulation or to be really precise, In Circuit Emulation (not to mix up with the emulated instructions inside the ZPU) is the standard method to test a CPU in real world, by interrupting its normal execution and feeding instructions via the Debug Port or better: TAP. After the CPU core has executed the so emulated instruction, it returns to emulation mode as long as the emulation bit is set. Leaving emulation again requires an instruction, we just use the same breakpoint instruction (0x00) for this. If the emulation bit is no longer set, the ZPU continues its normal operation, otherwise it executes the next instruction and returns to emulation mode.

This way, we can achieve everything in a simple way – we just have to make sure to save all CPU states in order to avoid being too intrusive. Remember, it can be a nightmare when the program runs when the debug monitor is active, but crash when not in debug mode. Or worse, vice versa.

Being non-intrusive is a matter of the software. On the ZPU we are changing the stack during most of the operations, so we have to explicitely fix it up before returning from emulation.

Let’s summarize what we needed to implement for the TAP – in VHDL modules:

  • jtagx.vhdl: The generic JTAG controller
  • tap.vhdl: The Test Access Port module, using the above JTAG controller. Other type of debug interfaces can be implemented, too

Between TAP and core (ZPU small), we have a bunch of signals and registers. These are merely:

  • emurequest: Request emulation mode (input, level sensitive)
  • emuexec: Execute emulated instruction (input, one clk wide pulse)
  • emuir: Emulation instruction register (input)
  • pc, sp, emudata: Program Counter, Stack pointer, Content at stack pointer (output)
  • state bits: What state is the CPU in?

To see in detail how these modules are linked with the core, see wb_core.vhdl.

Simulating the stuff

Before going into the hardware, we normally simulate things. This is reflected in the test bench hwdbg_small1_tb.vhd. Using the very useful trace module of the zealot ZPU variant, we can verify our architecture from the ZPU interface. Because we have used the TAP and JTAG side in other IP cores, we could safely omit them from the simulation.

Going to the hardware: Software test benches

Once we want to test everything on a real board (and run it over night), we need a JTAG adapter and some piece of software to run JTAG commands. We are using our own JTAG library based on the ICEbearPlus adapter, but any toolchain would do. So to test our primitives like “stop CPU”, “memory read/write”, etc. we just write a simple C program.

For example, the memory read function for 32 bit values, looks like:

uint32_t mem_read32(CONTROLLER jtag, uint32_t addr)
{
    REGISTER r;
    int q = jtag_queue(jtag, 0);
    scanchain_select(jtag, TAP_EMUIR);
    push_opcode(jtag, OPCODE_PUSHSP, EXEC);
    push_val32(jtag, addr);
    push_opcode(jtag, OPCODE_LOAD, EXEC);
    push_opcode(jtag, OPCODE_NOP, EXEC);
    scanchain_select(jtag, TAP_EMUDATA);
    scanchain_shiftout32(jtag, &r, UPDATE);
    scanchain_select(jtag, TAP_EMUIR);
    push_opcode(jtag, OPCODE_LOADSP | (LOADSP_INV ^ 0x01), EXEC); // Execute Stack fixup
    push_opcode(jtag, OPCODE_POPSP, EXEC);
    push_opcode(jtag, OPCODE_NOP, EXEC);
    jtag_queue(jtag, q); return r;
}

Basically, our JTAG sequences are hidden in functions like scanchain_select(), or scanchain_shiftout32(). With all shifting functions, we hint what state we want to enter after shifting. Whenever we enter EXEC, the TAP pulses the emuexec pin for a clock cycle, so the command in the emuir register is executed by the CPU.

Implementing the debugger

Once we have a little library with all basic functionality together, we can start wrapping it with a gdbproxy backend. Wait, what’s gdbproxy? This is a tiny little server, listening on a TCP port and waiting for gdb remote commands. The only thing we have to do: translate a set of skeleton functions into the appropriate calls of our library (called zpuemu). Like we’ve done this for the Blackfin a long time ago, we added another zpu target.

Another approach would be to use openOCD, since it supports a large number of JTAG adapters. The porting exercise we leave to others for now.

A real debugging session

So, let’s debug some program. We are using an old Spartan3 starter kit, equipped with a bunch of useful LEDs, but the main reason is: There is an existing ZPU setup with some I/O, found here: Softcore_implementation_on_a_Spartan-3_FPGA. Thanks to the authors for providing this.

In the image below you can see the Board with a bunch of PCBs stuck in. The ICEbear JTAG is connected to the expansion port, the big Coolrunner board behind is actually our ‘hacked’ Xilinx JTAG adapter, used to program the FPGA.
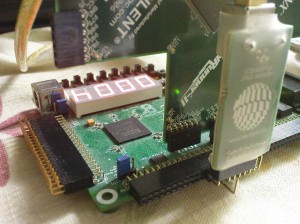
Spartan 3 board ZPU setup

What we had to do, is the swap the default ZPU implementation against the TAP-enhanced Zealot variant we used. Piece of cake.
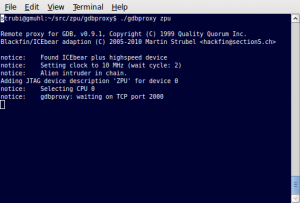
gdbproxy sessionNow let’s start hacking. We fire up our gdbproxy server as shown above, it is sitting there and waiting on port 2000.

Then we compile a little program for the ZPU that lights up a few LEDs. Provided that a full ZPU GCC toolchain is installed, the debugging session is dead simple, if you know gdb. Let’s see:

strubi@gmuhl:~/src/vhdl/core/zealot$ zpu-elf-gdb main
GNU gdb 6.2.1
...
(gdb) target remote :2000
Remote debugging using :2000
0x000005b5 in delay (i=5) at main.c:16
16            for (j = 0; j < 1000; j++) {
(gdb) fin
Run till exit from #0  0x000005b5 in delay (i=5) at main.c:16
[New Thread 1]
[Switching to Thread 1]
0x0000063a in main () at main.c:39
39            delay(10);
(gdb) b delay
Breakpoint 1 at 0x57d: file main.c, line 13.
(gdb) c
Continuing.

Breakpoint 1, delay (i=1) at main.c:13
13    {
(gdb)

This works like you might be used to doing it in the simulator. But on real hardware!

Things to try for the future

Actually, you might wonder, why the heck do we need two JTAG adapters? Can’t it be simpler?

In fact, it can. We have used our FPGA vendor independent JTAG I/O, but you could use the Xilinx JTAG primitives for Boundary Scan.

However, as far as I can see, there are only two user defined JTAG instructions. So our current TAP would not work, you would have to tunnel our TAP sequences through the USER1 and USER2 IRs or invent another protocol, for example, by packing our TAP scanchains into the USERx registers. This is again left to implementers, we’d love to hear whether this works though.

Update: By now, the ZPU and other soft cores are being debugged via the native Spartan3 and Spartan6 JTAG port using the BSCAN primitives from above.

Also, nobody forces you do use JTAG. You could just write a very simple interface to a uC and use the UART as debug interface port to the TAP.

So where do we go from here? Have a look at the recent experimental git branch via this link.